Data Visualization
Data transformation workflow
Comparing gene targets between multiple datasets
Scatterplot to illustrate correlation of expression levels between two genes
Predicting gene function by fold enrichment
Clinical data infographic
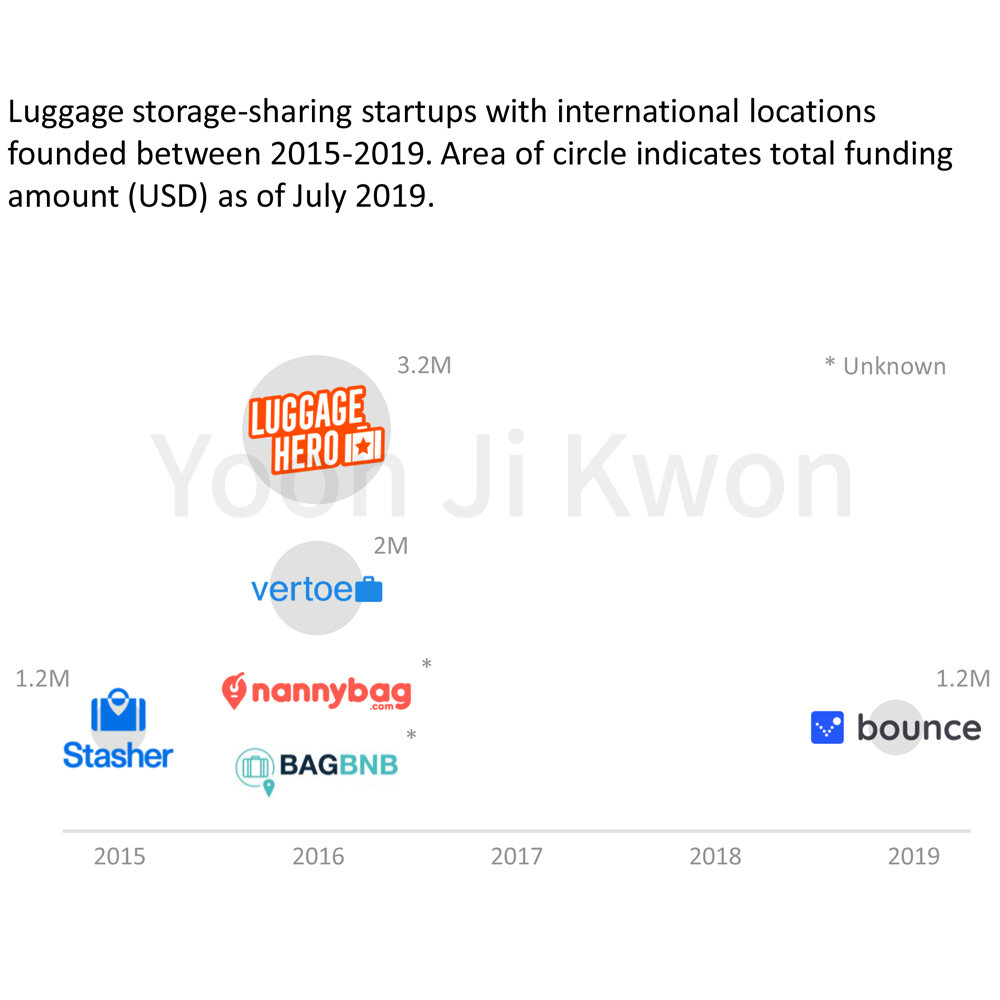
Capital raised by startups


